To configure Grafana Alerts with Amazon SNS, follow the steps below.
1. Create an SNS Topic
- Go to the AWS SNS Dashboard.
- Click Create topic.
- Choose the Standard topic type and enter a name for the topic.
- After the topic is created, click Create subscription.
- Select a protocol (e.g., Email or SMS) and provide the corresponding endpoint (email address or phone number).
- Confirm the subscription through the email/SMS sent by AWS.
2. Set Up AWS Credentials in Grafana
- In the AWS IAM Console, create an IAM user with a custom policy that grants sns:Publish permissions to your SNS topic.
{
    "Version": "2012-10-17",
    "Statement": [
        {
            "Sid": "VisualEditor0",
            "Effect": "Allow",
            "Action": "sns:Publish",
            "Resource": "<SNS-TOPIC-ARN>"
        }
    ]
}
- After creating the user, download the Access Key ID and Secret Access Key.
In Grafana:
- Go to Configuration → Data Sources.
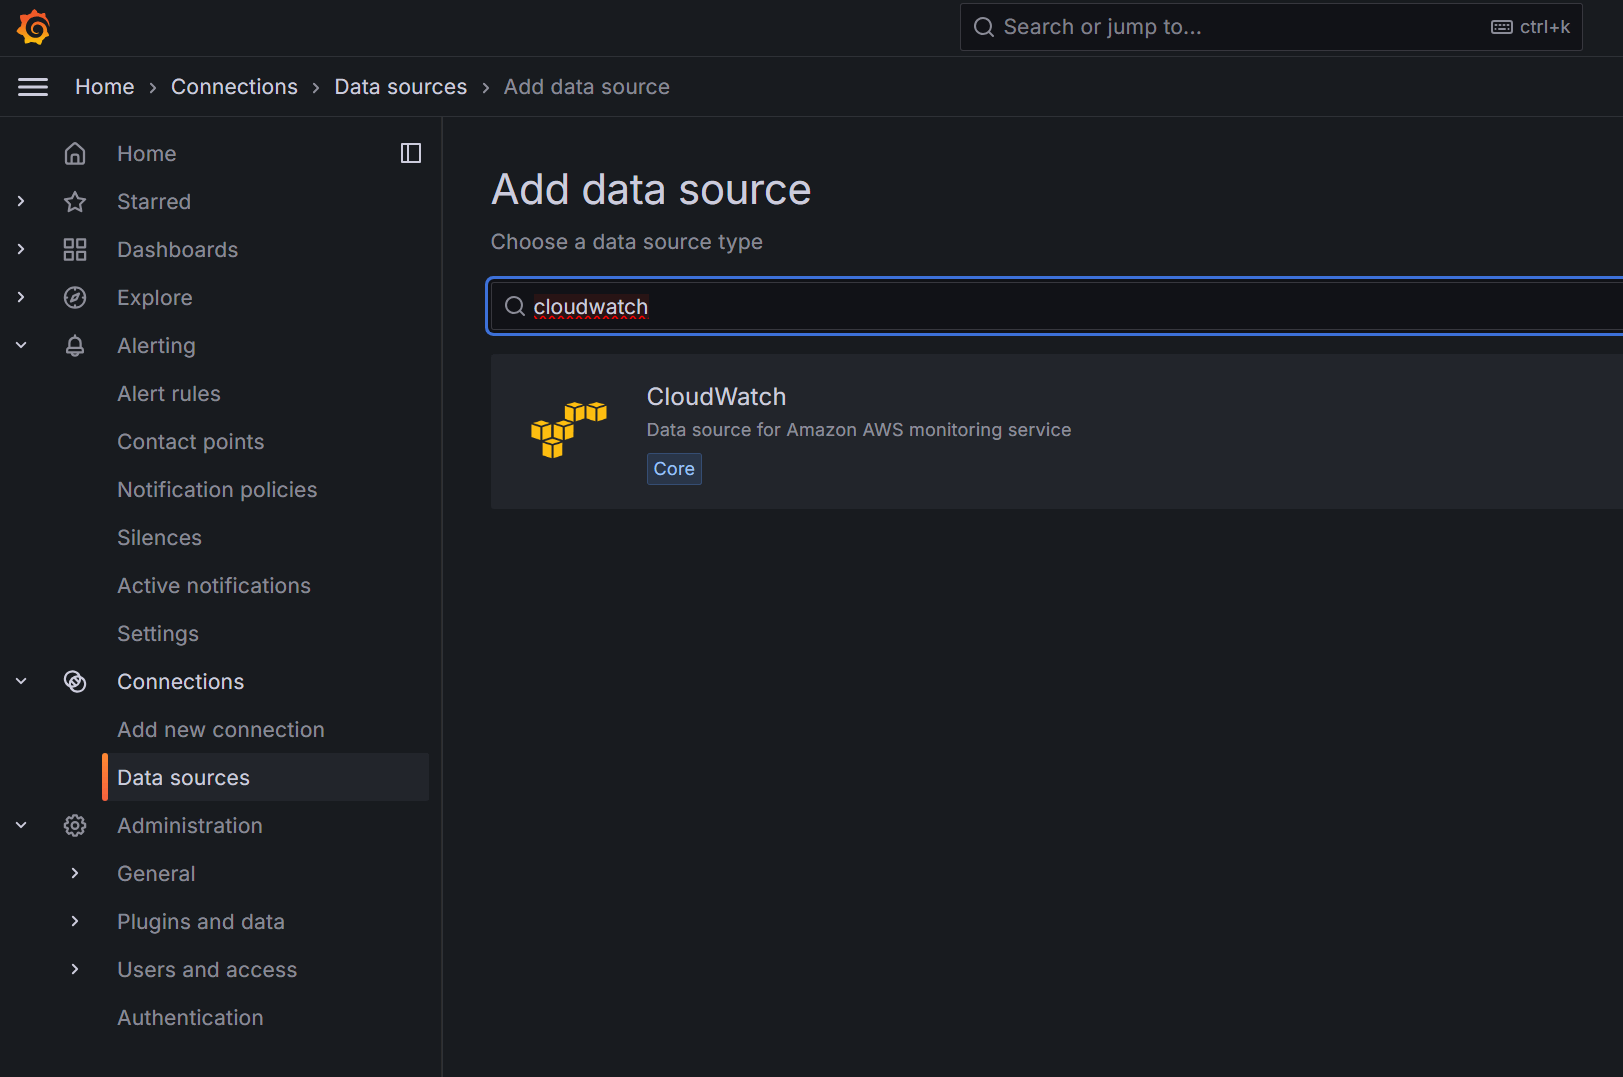
- Add a CloudWatch data source.

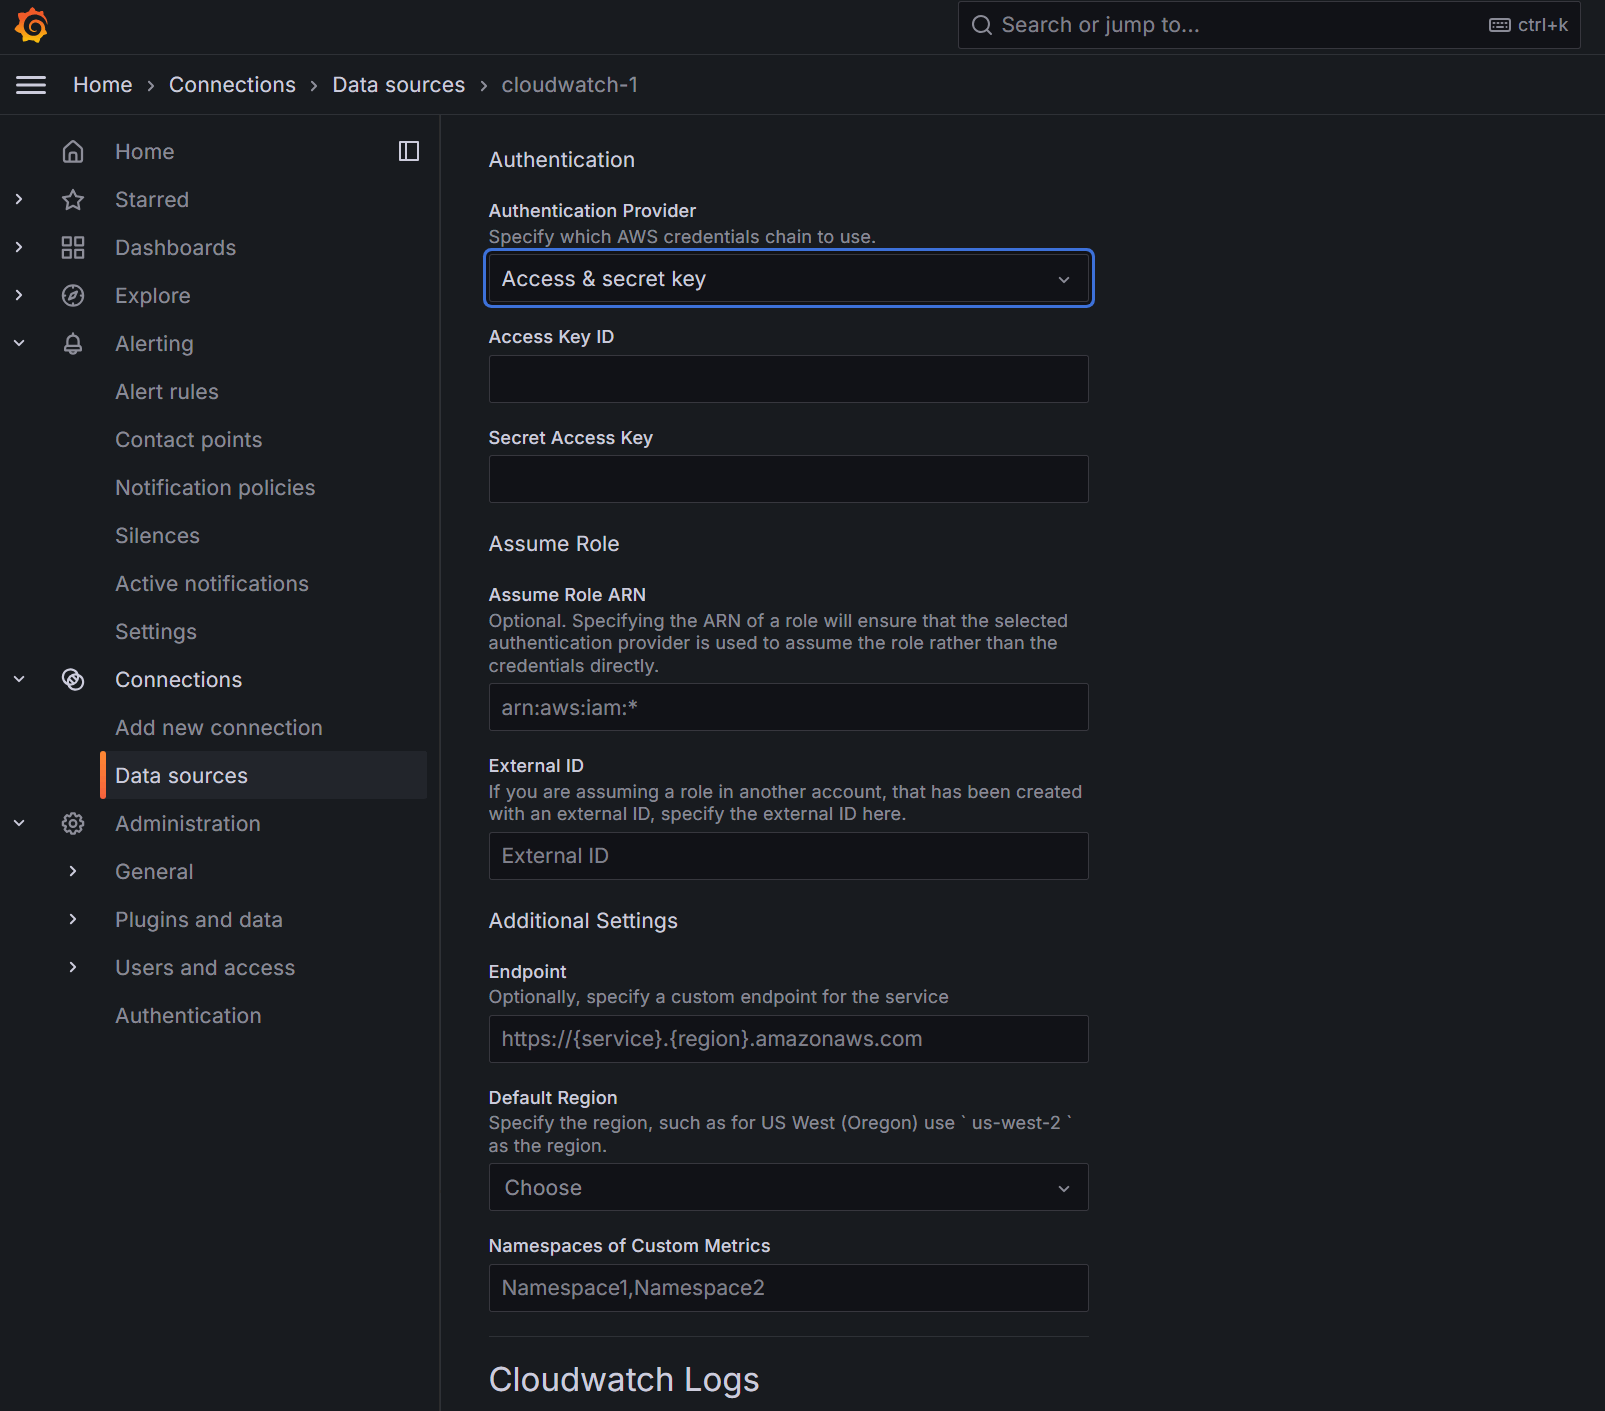
- Enter the Access Key ID, Secret Access Key, and AWS Region.

- At the bottom of the page, click on Save & test, you should see a displayed message saying 1. Successfully queried the CloudWatch metrics API. 2. Successfully queried the CloudWatch logs API.
3. Configure Grafana Contact point
- Go to contact points under Alerting then click on Add contact point.
- Enter a name for your contact point.
- Choose AWS SNS in Integration menu.
- In The Amazon SNS API URL, enter this : https://sns.{SNS-TOPIC-REGION}.amazonaws.com
- In the SNS Topic ARN, enter the ARN of the SNS topic that you created in step 1.
- Click Save contact point
- You can test the integration by clicking on Test on the top right of the screen
- You should receive an email/SMS on the email/number subscribed to the SNS topic.
4. Configure Your alert
- Go to Alert rules under Alerting then click on New alert rule.
- Give your alert rule a name.
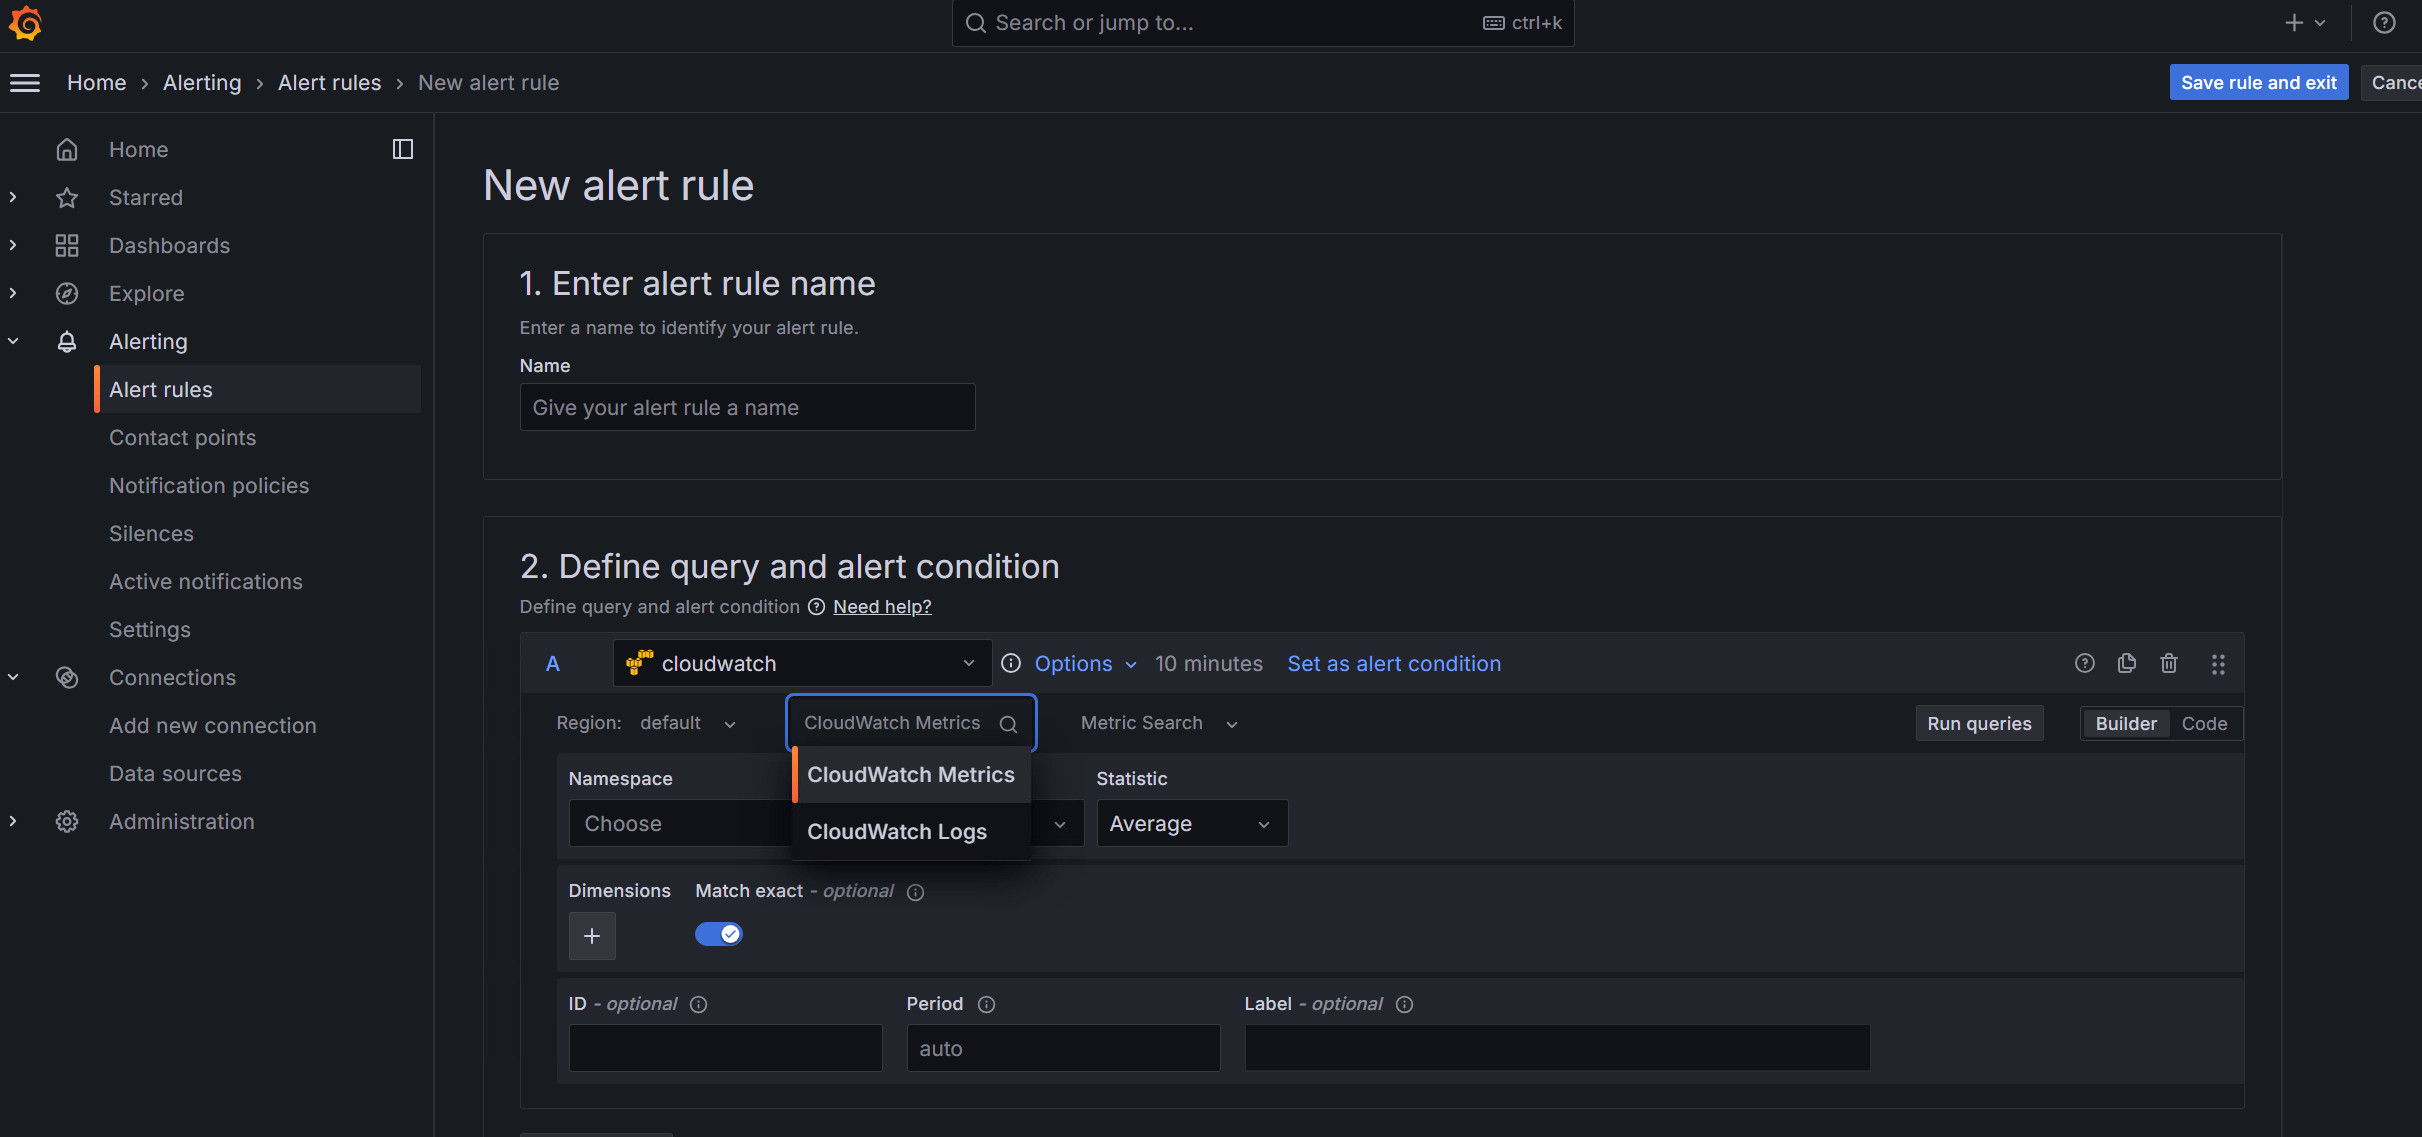
- under Define query and alert condition select the Data source entered in step 2.
- You can select CloudWatch Metrics or CloudWatch Logs.

- Select what metrics or log group you want to query on.
- In section B select a reduce option to get a single number out of your query A
- In section C you can select your threshold, this will be the trigger for your alert.
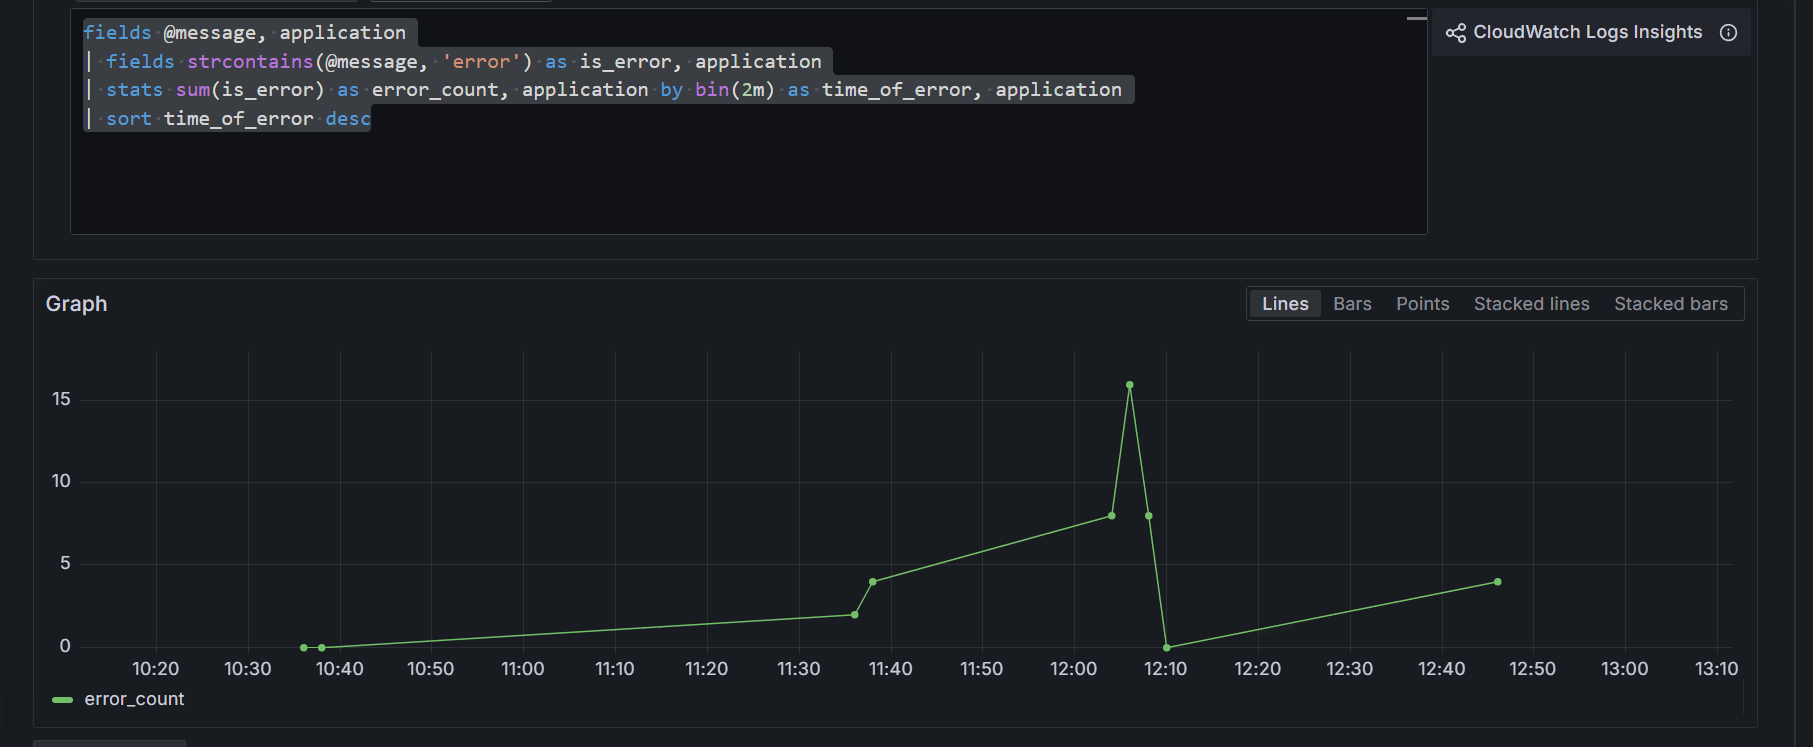
- Comment : if you want to use logs, you will need to adapt your query to filter in a data series format.
- Example
fields @message, application
| fields strcontains(@message, 'error') as is_error, application
| stats sum(is_error) as error_count, application by bin(2m) as time_of_error, application
| sort time_of_error desc
- This is a query that will look up for any log that contains the word error and turn the result into data series.

- Scroll down, Create a new folder and select it.
- You will need to create an evaluation group in order to define how often the alert rule is evaluated, you can choose values from 10s to 1h.
- Pending period is how long the threshold configured in section C needs to be met to trigger the alert rule.
- Last mandatory entry will be the contact point that will be used to send the notifications, you can find the contact point created in Step 3 in the menu.
- Click Save rule and exit on top right
- You will start receiving notifications (email/SMS) whenever your alert rule conditions are met.